
Learn how to visualize and filter from various multi choice options in Power BI from SharePoint
The challenge
When working with SharePoint data in Power BI, it can be a challenge to expand and filter lookup, people and choice fields with multiple values
Here you will learn how to both visualize and filter multi choice values
Initial setup
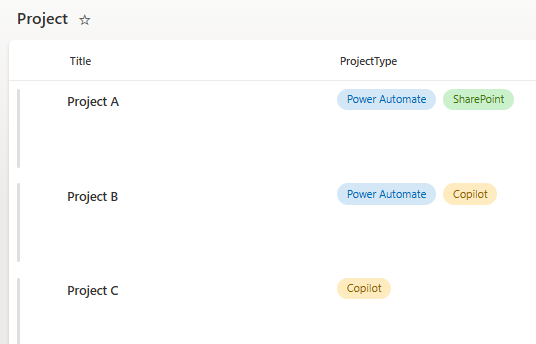
Create a new list called Project with a choice column called ProjectType with the following options
- Power Automate
- SharePoint
- Copilot
Don’t forget to the set value Allow multiple selections to Yes
Get data
In Power Query create a new blank query and click advanced editor
Insert the following code (with needed adjustments, explained below the code snippet)
let
    BaseURL = "https://YOURTENANTNAME.sharepoint.com/sites/YOURSITENAME/",
    ListName = "YOURLISTNAME",
    Select = "Title,Author,ProjectType,ID",
    ExpandColumns = "Author/Title",
    Expand = "Author",

    CountItems = Json.Document(Web.Contents(BaseURL, [RelativePath = "_api/web/lists/GetByTitle('" & ListName & "')/items?$select=ID&$orderby=ID%20desc&$top=1", Headers = [Accept = "application/json"]]))[value]{0}[ID],
    StartID = List.Numbers(0, Number.RoundUp(CountItems / 5000), 5000),

    #"Converted to Table" = Table.FromList(StartID, Splitter.SplitByNothing(), null, null, ExtraValues.Error),
    EndID = Table.AddColumn(#"Converted to Table", "Custom", each [Column1] + 4999, type number),
    #"Renamed Columns" = Table.RenameColumns(EndID,{{"Column1", "StartID"}, {"Custom", "EndID"}}),
    #"Changed Type" = Table.TransformColumnTypes(#"Renamed Columns",{{"StartID", type text}, {"EndID", type text}}),
    selectedfields = "&$top=5000&$select="& Select & "," & ExpandColumns & "&$expand=" & Expand,
    ListItems = Table.AddColumn(#"Changed Type", "ListItems", each Json.Document(Web.Contents(BaseURL, [RelativePath = "_api/web/lists/GetByTitle('" & ListName & "')/items?$filter=(ID ge " & [StartID] & ") and (ID le " & [EndID] & ")&$top=5000&$select="& Select & "," & ExpandColumns & "&$expand=" & Expand, Headers = [Accept = "application/json"]]))[value]),
    #"Removed Other Columns" = Table.SelectColumns(ListItems,{"ListItems"}),
    #"Expanded ListItems" = Table.ExpandListColumn(#"Removed Other Columns", "ListItems")
in
    #"Expanded ListItems"
Change the following variables
BaseUrl
Change to your own site (don’t forget the last /)ListName:
Change to your list name (the actual name, the one you see on your site)ExpandColumns:
If you want to expand any columns like a people field, and get the title (name) or the EMail, you insert the expand columns here, like below:ExpandColumns = "Author/Title,Editor/Title,PersonColumn/EMail,PersonColumn/Title,LookupColumn/Title",Expand:
Everytime you introduce a new column to expand, it is important you write the name here, like this:Expand = "Author,Editor,PersonColumn,LookupColumn",Select:
We are only selecting the actual columns that we need. You can replace it with an asterix (*) that will return all columns from SharePointSelect = "Title,Author,ProjectType,ID"
Step 2
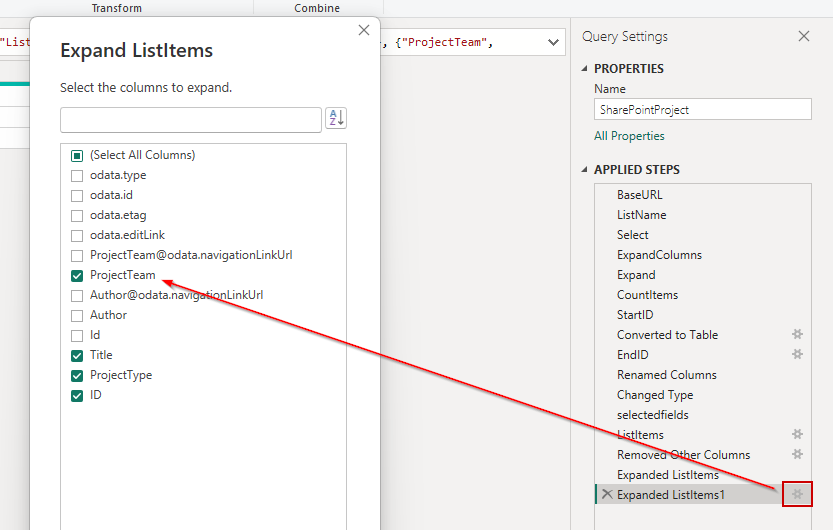
You can now select the arrow icon and click expand

Unclick use original column name as prefix and click OK

Notice that everytime you introduce a new column, you need to go back to this step, and select the new column
Note the that code above will only work if you have at least 1 expand column introduced.
Setup staging and transform
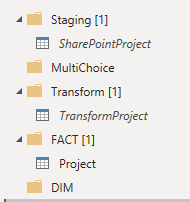
Before you continue with your steps, setup staging, transform, dim, & fact tables.
Do the initial setup like below
Multichoice
We are doing this change in TransformProject
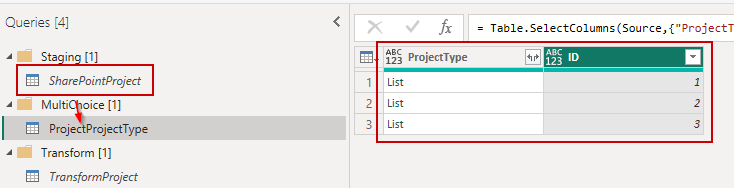
Your multichoice will be shown currently as a list:
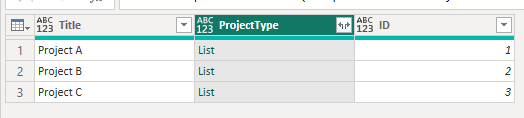
We want to extract the values, so that the user can see the values in the report.
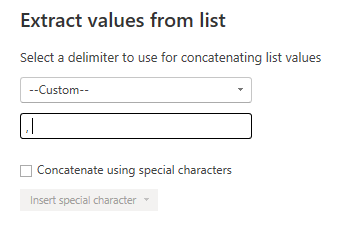
Select the two arrows icon in the top right corner and select Extract Values
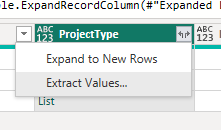
Choose Custom and extract with a comma and a space
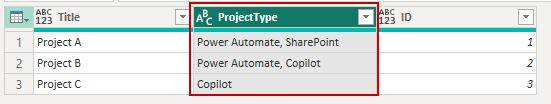
The column is now available visually for the user in a report.
Filtering a multichoice
To be able to filter the ProjectType we will create a new dimension.
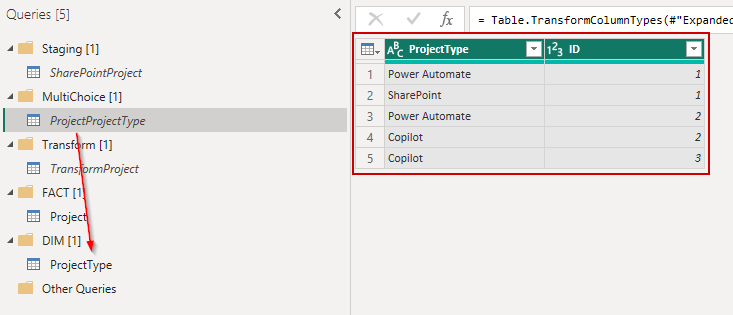
Create a reference from your staging table and move it to the MultiChoice group
Either Remove or Choose columns so that we only have ID and ProjectType in our table.
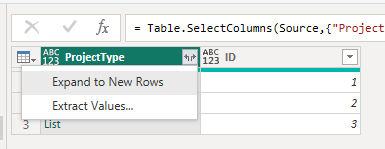
This time we expand ProjectType to New rows
Finally we reference our multichoice table to our dimensions
You can now close Power Query for the final step
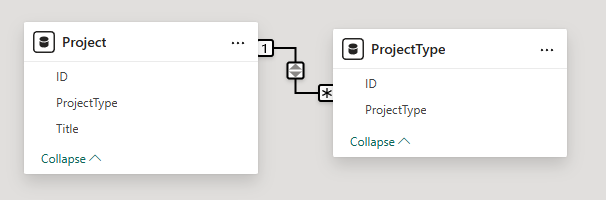
Model
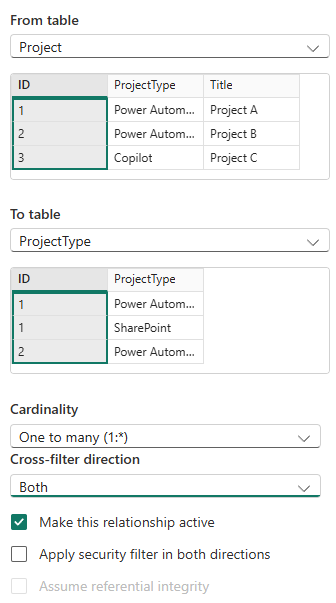
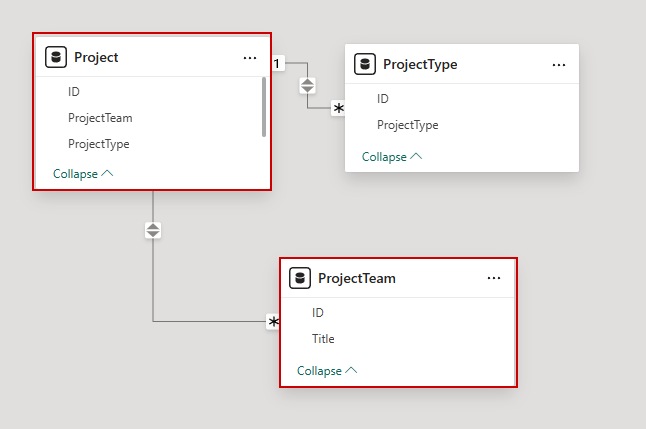
In the model reference ID with ID in both tables, and set the direction to Both
Report
We can now create a report
From the table called Project insert Title and Project Type into a table visual
From the table called ProjectType insert the ProjectType column into a slicer visual
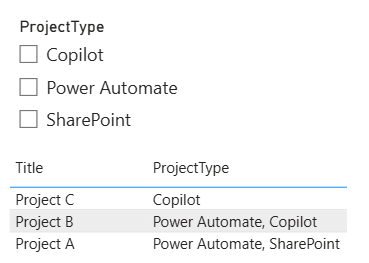
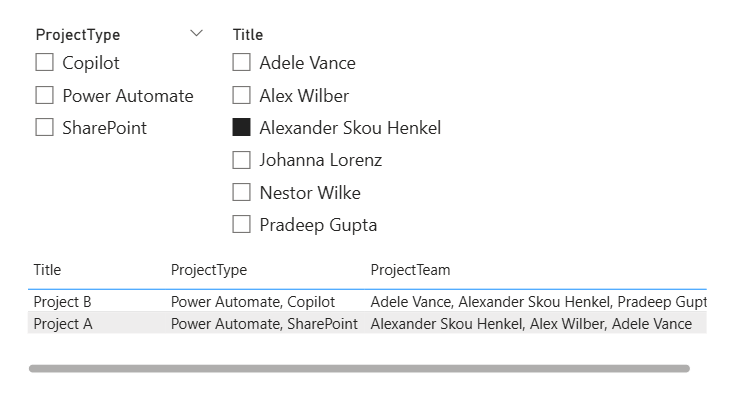
We can now filter a multi choice column
Here we see the table unfiltered
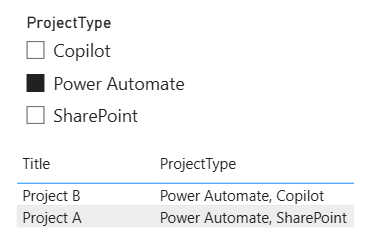
Here we see the table filtered
Multi people column
Step 1
Let’s go back to staging and add ProjectTeam to our select and expand
Select = "Title,ProjectType,ID,Author,ProjectTeam",
ExpandColumns = "Author/Title,ProjectTeam/Title",
Expand = "Author,ProjectTeam",
Don’t forget to add the new column from your last step
Step 2
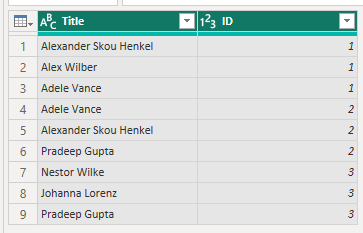
Create a new reference to your staging table.
Remove the other columns so that you only have ID and ProjectTeam
Step 3
Expand ProjectTeam to New rows and next expand to title
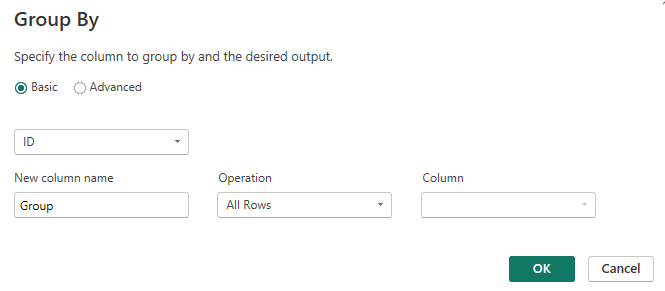
Mark your ID column and in the menu under Transformation select Group By
Choose the settings as below
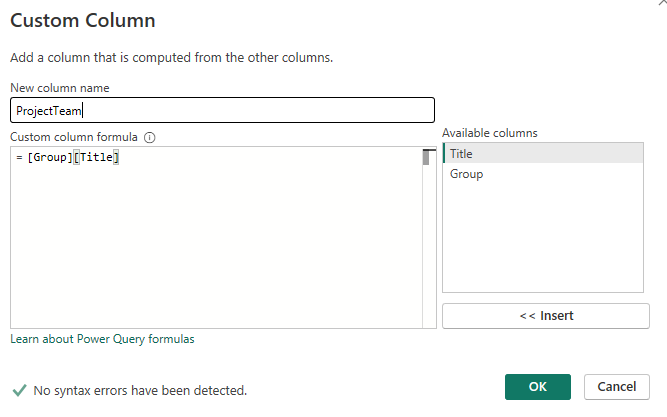
Create a new custom column and write:
[Group][Title]
Extract the values with a custom “, "
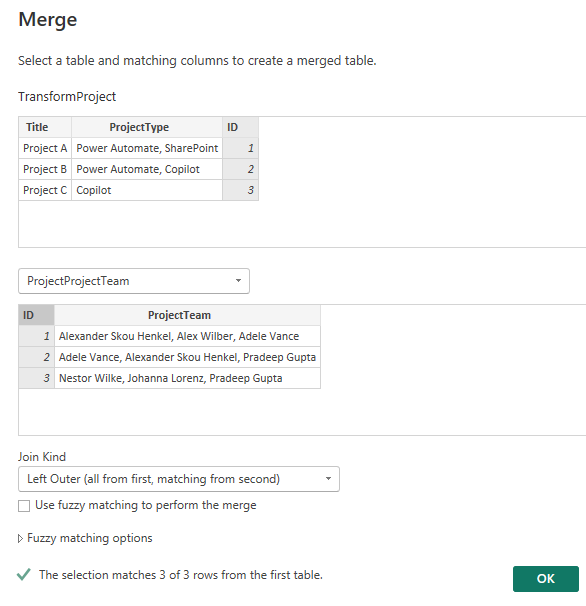
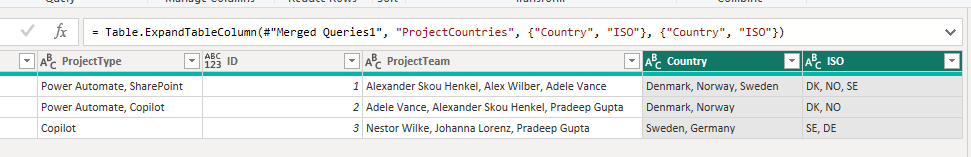
In your transform table we can now merge the project team and expand it
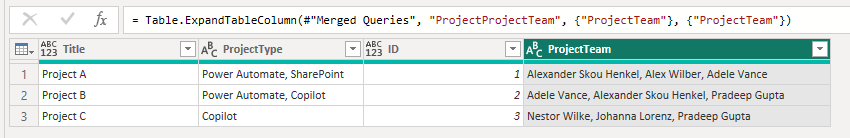
Your table should now look like this
Step 4
Now we need to create a dimension table so that we can filter.
Create a new reference to your staging table and keep ID and ProjectTeam
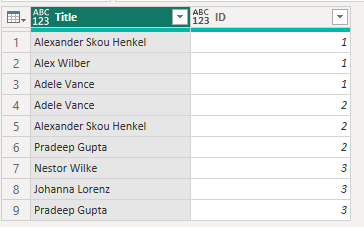
Expand ProjectTeam to new rows and expand Title
Your table should now look like this
Step 5
In the model view we can now bind the Project table with our dimension table
In the report view add a slicer with the names from our dimension table, and in the table view add the column from our project view
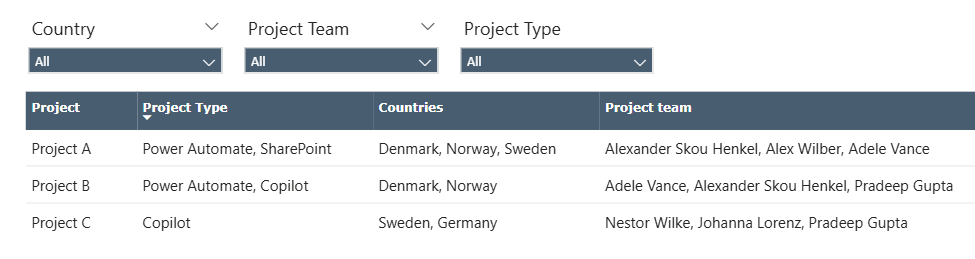
Our report can now filter on a multi choice people column
Multi lookup column
The lookup column follows the same principle as the people field.
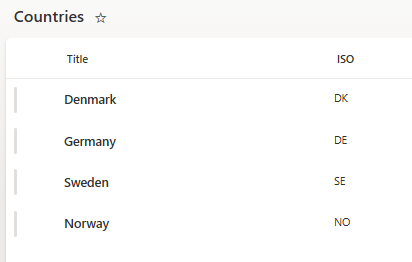
For this list we will also add ISO to the list, so that we can filter on both the country name and country ISO
Step 1
Add countries to the staging table and expand both Title and ISO
Select = "Title,ProjectType,ID,Author,ProjectTeam,Countries",
ExpandColumns = "Author/Title,ProjectTeam/Title,Countries/Title,Countries/ISO",
Expand = "Author,ProjectTeam,Countries",
Step 2
Reference a new table and group them by ID and create new custom columns for both Title and ISO
[Group][Title]
[Group[ISO]]
Here are the full steps
let
    Source = SharePointProject,
    #"Removed Other Columns" = Table.SelectColumns(Source,{"Countries", "ID"}),
    #"Expanded Countries" = Table.ExpandListColumn(#"Removed Other Columns", "Countries"),
    #"Expanded Countries1" = Table.ExpandRecordColumn(#"Expanded Countries", "Countries", {"Title", "ISO"}, {"Title", "ISO"}),
    #"Grouped Rows" = Table.Group(#"Expanded Countries1", {"ID"}, {{"Group", each _, type table [Title=text, ISO=text, ID=number]}}),
    #"Added Custom" = Table.AddColumn(#"Grouped Rows", "Country", each [Group][Title]),
    #"Added Custom1" = Table.AddColumn(#"Added Custom", "ISO", each [Group][ISO]),
    #"Extracted Values" = Table.TransformColumns(#"Added Custom1", {"ISO", each Text.Combine(List.Transform(_, Text.From), ", "), type text}),
    #"Extracted Values1" = Table.TransformColumns(#"Extracted Values", {"Country", each Text.Combine(List.Transform(_, Text.From), ", "), type text}),
    #"Removed Columns" = Table.RemoveColumns(#"Extracted Values1",{"Group"}),
    #"Changed Type" = Table.TransformColumnTypes(#"Removed Columns",{{"ID", Int64.Type}, {"Country", type text}, {"ISO", type text}})
in
    #"Changed Type"
Step 3
Merge the table into the transform table
Step 4
Reference the staging table to create a new dimension table.
As we did earlier, expand to new rows
Here are the full steps
let
    Source = SharePointProject,
    #"Removed Other Columns" = Table.SelectColumns(Source,{"Countries", "ID"}),
    #"Expanded Countries" = Table.ExpandListColumn(#"Removed Other Columns", "Countries"),
    #"Expanded Countries1" = Table.ExpandRecordColumn(#"Expanded Countries", "Countries", {"Title", "ISO"}, {"Title", "ISO"}),
    #"Changed Type" = Table.TransformColumnTypes(#"Expanded Countries1",{{"Title", type text}, {"ISO", type text}, {"ID", Int64.Type}})
in
    #"Changed Type"
Step 5
Relate the dimension table to the fact table
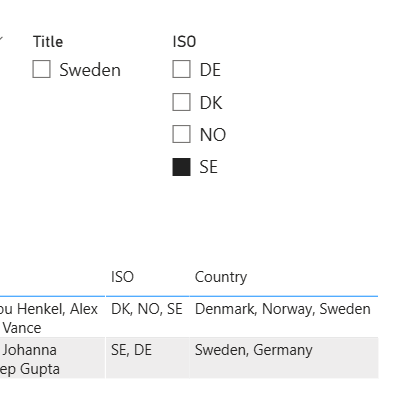
We can now filter on both country and ISO
You can download my example Power BI report here

